Let’s use PyTorch Profiler to get a better understanding of what happens under the hood during LLM inference. The model we’re going to use is the 1B parameter instruction-tuned version of Gemma3 from HuggingFace model hub. I’m going to make use of RTX 4090 GPU on a RunPod vm instance. The profiling code can be found in this Gist
quantization_config = BitsAndBytesConfig(load_in_8bit=True)This configures to load the model parameters as 8-bit integers to reduce memory footprint of the model. This is the bulk of the memory usage; hence, lots of space saving.
inputs = tokenizer.apply_chat_template(...).to(model.device).to(torch.bfloat16)We load the input tensor as bfloat16 as accommodate the wider dynamic range of activations.
We profile inference by wrapping profile() around model.generate():
with torch.inference_mode():
    with profile(activities=[ProfilerActivity.CUDA]) as prof:
        with record_function("model_inference"):
            outputs = model.generate(**inputs, max_new_tokens=64)
ProfilerActivity.CUDA is saying that we only want to profile operations on GPU. The detailed output is here. In summary, there are two types of operations on GPU - matrix multiplication (called gemm kernels) and elementwise operations such as normalization, activation function, etc.
| CUDA Kernel | Self CUDA % |
|---|---|
| gemm_kernel | 18% |
| elementwise_kernel | 82% |
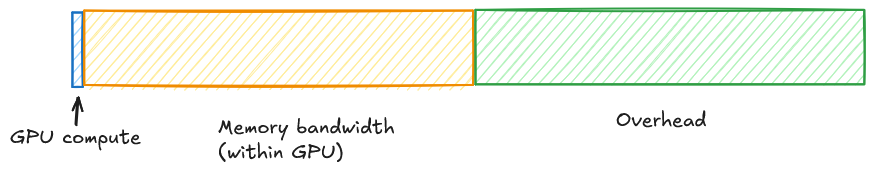
Observation 1: The majority of time is spent on elementwise operations. This happens because LLM inference consists of one prefill step and all the rest decode steps. Due to KV-caching, these decode steps involve thin matrix multiplications, thereby under-utilizing the GPU. This is bad news because elementwise operations use particular cores on the GPU that have much lower throughput than the cores used for matrix multiplication. This also implies our second observation.
Observation 2: To predict each token, all the model parameters have to be shunted from GPU global memory (DRAM/HBM) to shared memory (SRAM). Memory transfer is relatively expensive and to make good use of this expense, we usually try to amortize by doing a lot of computation on the transferred data. This becomes difficult in our scenario where matrix multiplications are thin and elementwise operations are dominant. We say that our inference computation is memory-bound.
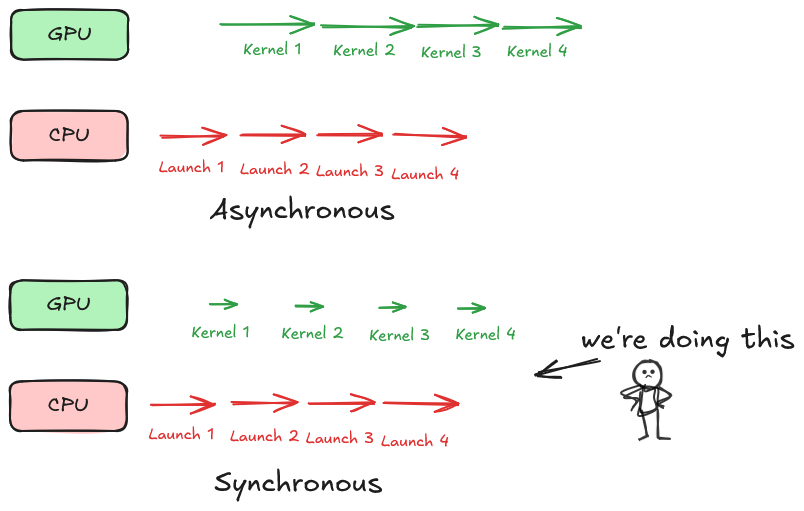
Observation 3: Over the course of inference, the CPU is launching a huge number of CUDA operations for the GPU to perform and the GPU performs each very quickly and waits idly for the next command. Anything happening on the CPU is like a overhead and these arise from slow Python interpreter, layers of dispatch on PyTorch framework, and launching of CUDA kernels for the GPU. As shown by the following numbers from the profiler, CPU overhead is significant in our case.
Self CPU time total: 2.502s
Self CUDA time total: 1.196s
In this case, GPU and CPU are operating synchronously - a bad state of affairs. We can also say we’re overhead-bound.
Overall, we can characterize our workload as follows:
So, what options have we got?
- ❌ No point optimizing already efficient matmul/sgemm kernels since GPU compute is such a tiny part of the equation.
✅ Use efficient serving engines like vLLM or SGLang or TGI. They do various QoL improvements such as CUDA graphs, speculative decoding, PagedAttention, and more.
Thanks to Eric, Jeremy, and Ramjee for helpful discussions.